Two Population Groups
What do we really find in our data?
So far, we have only differentiated the 400 individuals in our dataset by whether they are creditworthy (dark blue) or not (light blue).
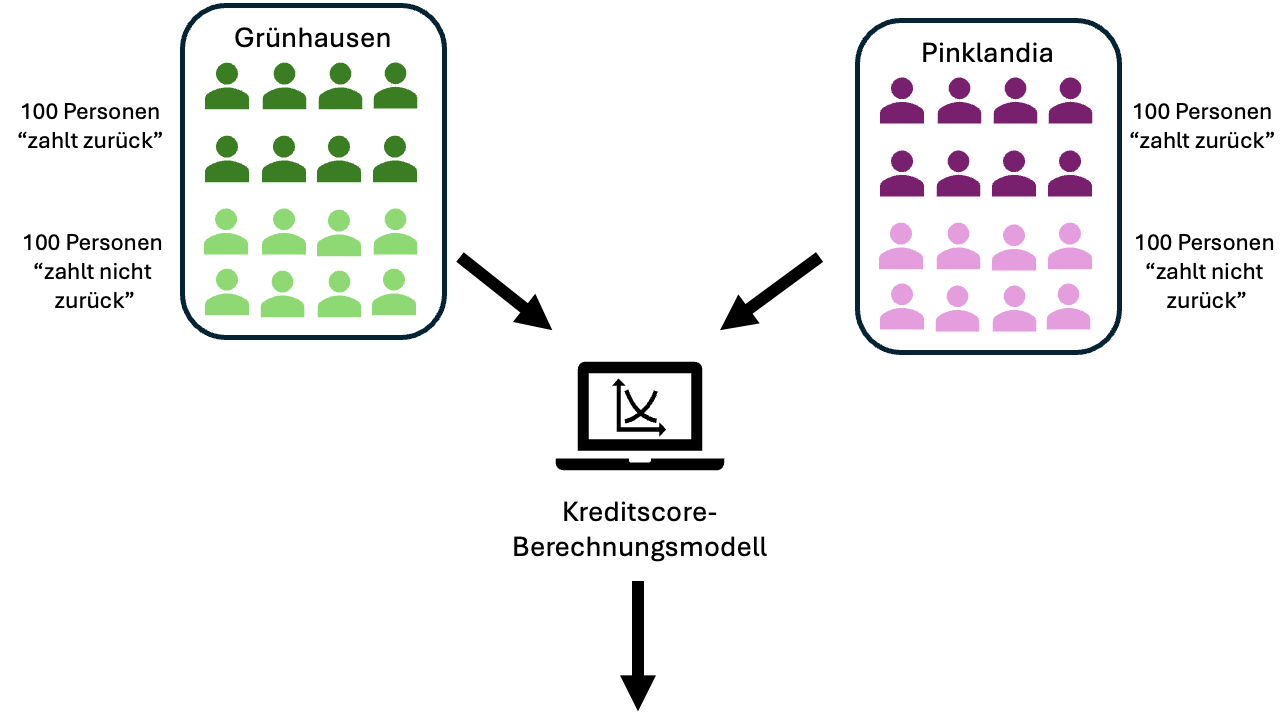
However, we actually know more. Our dataset consists of two population groups that differ in a significant characteristic. This characteristic could be, for example, gender, ethnicity, or age (old vs. young). In our example dataset, we distinguish individuals by their fictional origin from “Greenland” and “Pinklandia.”
In both population groups, there are 100 creditworthy and 100 non-creditworthy individuals. Thus, in both populations, the likelihood of a person being creditworthy is the same.
However, the application of the credit score model results in clearly different distributions for the two groups. This is evident in the graphics below.
- Find as many points of criticism as possible regarding this approach.
- Argue from the bank’s perspective why this could be a good approach.